Note
Go to the end to download the full example code.
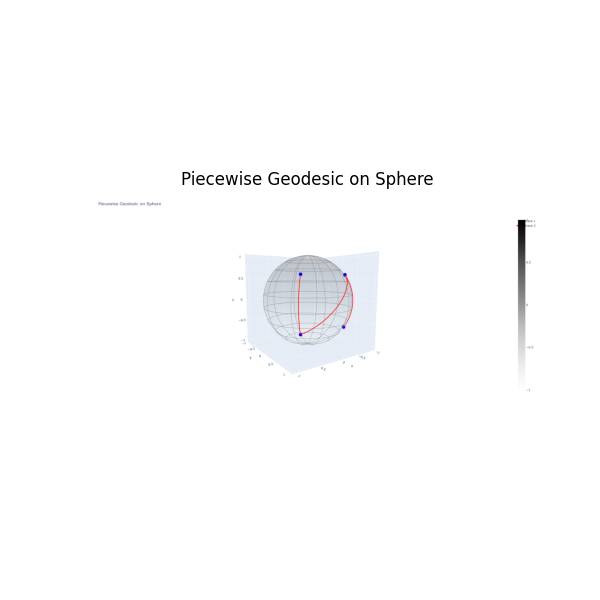
Piecewise Geodesic Example#
Compute and visualize a piecewise geodesic curve on the unit sphere.
import numpy as np
import plotly.graph_objects as go
import plotly.io as pio
from spheresmooth import piecewise_geodesic

# -------------------------------------------------------------
# Example setup
# -------------------------------------------------------------
c = 1/np.sqrt(3)
control_points = np.array([
    [ c,  c,  c],
    [ c,  c, -c],
    [-c,  c,  c],
    [-c,  c, -c]
])
knots = np.array([1, 2, 3, 3.5])

t = np.linspace(0, 4, 300)
curve = piecewise_geodesic(t, control_points, knots)

# -------------------------------------------------------------
# Sphere mesh
# -------------------------------------------------------------
u = np.linspace(0, 2*np.pi, 60)
v = np.linspace(0, np.pi, 30)
x = np.outer(np.cos(u), np.sin(v))
y = np.outer(np.sin(u), np.sin(v))
z = np.outer(np.ones_like(u), np.cos(v))

# -------------------------------------------------------------
# Plot
# -------------------------------------------------------------
fig = go.Figure()

# Sphere surface
fig.add_surface(
    x=x, y=y, z=z,
    opacity=0.1,
    colorscale="Greys",
    showscale=False
)

# Control points
fig.add_trace(go.Scatter3d(
    x=control_points[:, 0],
    y=control_points[:, 1],
    z=control_points[:, 2],
    mode='markers',
    marker=dict(size=5, color='blue', opacity=1),
    name='Control Points'
))

# Geodesic path
fig.add_trace(go.Scatter3d(
    x=curve[:, 0],
    y=curve[:, 1],
    z=curve[:, 2],
    mode='lines',
    line=dict(color='red', width=6),
    name='Piecewise Geodesic'
))

# Optional: lat/long grid
lat_values = np.linspace(-60, 60, 8)
for lat in lat_values:
    phi = np.radians(lat)
    ugrid = np.linspace(0, 2*np.pi, 200)
    fig.add_trace(go.Scatter3d(
        x=np.cos(ugrid) * np.cos(phi),
        y=np.sin(ugrid) * np.cos(phi),
        z=np.full_like(ugrid, np.sin(phi)),
        mode='lines',
        line=dict(color='gray', width=1),
        showlegend=False
    ))

lon_values = np.linspace(0, 330, 12)
for lon in lon_values:
    lam = np.radians(lon)
    vgrid = np.linspace(-np.pi/2, np.pi/2, 200)
    fig.add_trace(go.Scatter3d(
        x=np.cos(vgrid) * np.cos(lam),
        y=np.cos(vgrid) * np.sin(lam),
        z=np.sin(vgrid),
        mode='lines',
        line=dict(color='gray', width=1),
        showlegend=False
    ))

fig.update_layout(
    title="Piecewise Geodesic on the Sphere",
    scene=dict(
        xaxis=dict(visible=False),
        yaxis=dict(visible=False),
        zaxis=dict(visible=False),
        aspectmode="data"
    )
)

import matplotlib.pyplot as plt
import matplotlib.image as mpimg

img = mpimg.imread("piecewise_geodesic_example.png")

plt.figure(figsize=(6, 6))
plt.imshow(img)
plt.axis("off")
plt.title("Piecewise Geodesic on Sphere")
plt.show()
Total running time of the script: (0 minutes 0.260 seconds)